I have literally tested every indicator you can think of in my seven years of crypto trading.
As a beginner trader some years ago, I thought there was one magic indicator that would tell you when to buy or sell, but such indicator doesn’t exist.
An effective crypto trading strategy involves using multiple trading indicators to help predict the direction of the markets.
In this article, I will share my best indicators for crypto trading based on my experience.
If you’re ready, let’s dive in
7 Best Indicators For Crypto Trading
1. Andrew’s Pitchfork (Most Recommended)
Dr. Alan Andrews developed the pitchfork concept during his days as a trader.
The tool is the most reliable of all the indicators because it gives you the direction of the market faster than the others.
In crypto trading, timing is everything.
The earlier you enter a trade, the more likely you will make a profit and reduce risk.
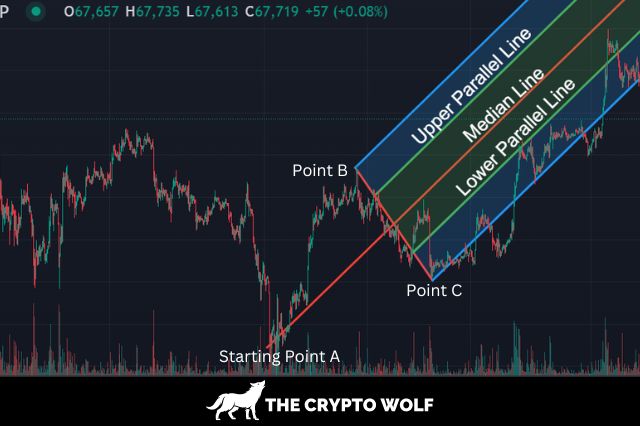
The pitchfork is drawn by identifying three points on a chart, using a high-low-high or a low-high-low setup.
When you want to draw the pitchfork, you use a significant pivot high, a significant pivot low, and another pivot high or low.
The diagram of how it’s drawn is shown below:
Understanding Andrew’s Pitchfork Lines
The pitchfork consists of three lines, as explained below:
The Median Line: The pitchfork has a middle line called the median line.
It acts like a magnet pulling price towards itself.
Dr. Andrews observed that prices often reach the median line 80% of the time before reversing.
If the price fails to reach the median line, it’s called a price failure.
Upper parallel and lower parallel lines: these upper or lower lines act as potential support and resistance lines.
In an uptrend, the upper parallel line can act as potential resistance levels, while in a downtrend, the lower parallel line acts as support.
The Accuracy Of The Pitchfork
To accurately use the pitchfork for price predictions, you must choose the right three points on a chart.
Identifying the correct three points gets better with practice and experience.
The pitchfork is not to be used alone because it might produce inaccurate signals; it’s best paired with the next indicator below:
2. Relative Strength Index (RSI)
The relative strength index (RSI) is an indicator that helps you determine the strength or weakness of a trend.
The RSI ranges from 0 to 100, and it’s used to identify whether a cryptocurrency is overbought or oversold.
A reading above 70 is overbought, while a reading below 30 is oversold.
When a cryptocurrency is overbought, traders are careful not to open a new position because they expect a downward reversal.
In an oversold situation, traders start to accumulate because they expect a reversal to the upside.
The RSI has an important component that gives more information concerning the strength or weakness of a trend and it’s called divergence.
What Is RSI Divergence?
RSI divergence is when the price of an asset (in this case, crypto) moves in the opposite direction from the RSI indicator.
There are two main types of divergence, and they are listed below:
Bullish Divergence: this is when the price of an asset makes a new low, but the RSI indicator forms a higher low
It suggests that selling momentum is getting weak, and a move to the upside is imminent.
Bearish Divergence: occurs when the price of an asset makes a higher high while the RSI indicator makes a lower high.
The bearish divergence shows that an asset uptrend is getting weak and will soon reverse.
Pro tip: tradingview has an indicator called divergence indicator; it’s built based on the RSI.
With the divergence indicator, you don’t have to spot divergence manually. The indicator does it automatically.
For accurate signals, you should pair the pitchfork with the divergence indicator.
3. Moving Average Convergence Divergence (MACD)
The moving average convergence divergence is a popular trading indicator that helps traders identify the strength of a trend.
The indicator often reveals the sentiments of traders in the market.
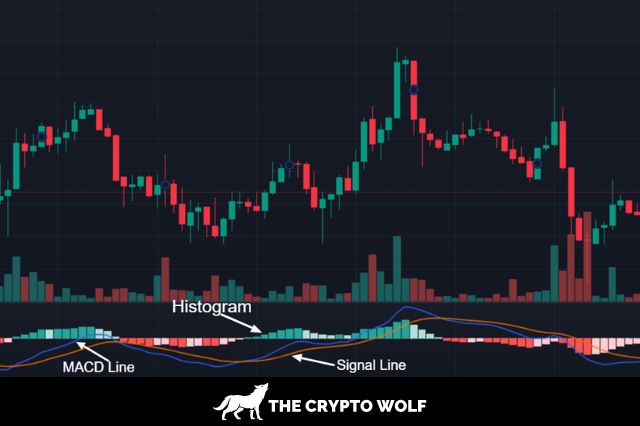
The MACD consists of three main components, which are discussed below:
The MACD Line: for the MACD line, the 26-period is subtracted from the 12-period exponential moving average.
The result is a single line that oscillates above and below zero.
The 12-period EMA represents the short-term trend, while the 26-period EMA represents the longer-term trend.
Signal Line: The signal line is a 9-period Exponential moving average of the MACD line.
It is plotted on the same chart as the MACD line and helps to smooth out its fluctuations.
The crossing of the MACD line above or below the signal line generates buy or sell signals.
Histogram: The histogram is a visual representation of the difference between the MACD line and the signal line.
When the MACD line is above the signal line, the histogram is positive, indicating bullish momentum.
When the MACD line is below the signal line, the histogram is negative, indicating bearish momentum.
How To Use MACD Indicator For Trades
Signal Line Crossings: A buy signal is generated when the MACD line crosses above the signal line,
And a sell signal is generated when it crosses below the signal line.
Zero Line Crossings: When the MACD line crosses above the zero line, it suggests bullish momentum, and when it crosses below the zero line, it suggests bearish momentum.
Divergence: Similar to RSI divergence, traders also look for divergence between the MACD and the price chart to identify potential trend reversals.
The MACD is versatile and can be used in various market conditions.
Traders often use it to confirm trends, spot potential reversals, and generate signals for buying or selling.
As with any technical indicator, it’s essential to use the MACD in conjunction with other analysis tools.
4. Volume Weighted Average Price (Best For Day Traders)
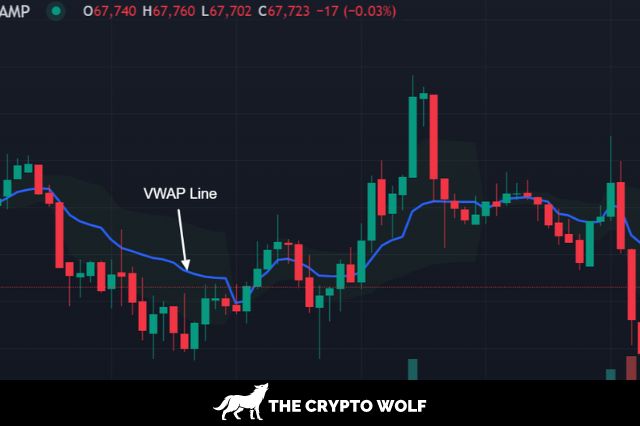
The volume-weighted average price (VWAP) is a trading indicator that calculates the average price of an asset over a given period,
Taking into account the volume during that time.
It’s a powerful indicator for day traders.
The VWAP provides comprehensive information about an asset’s average price by considering both price and volume,
Unlike the simple moving average indicator, which only considers the price.
Traders often use the VWAP to calculate the average price of an asset throughout the day, which helps determine potential entry and exit points.
How To Trade Using VWAP
Trend Identification: If the current price is above VWAP, it may indicate a bullish trend.
If the VWAP is below, it might suggest a bearish trend.
Reversals and Breakouts: Look for price crossing VWAP from below as a potential bullish signal.
Conversely, a price crossing VWAP from above may be considered a bearish signal.
VWAP Crossovers: Track short-term VWAP (e.g., hourly) and longer-term VWAP (e.g., daily).
A crossover (short-term VWAP crossing above long-term VWAP) may signal a potential uptrend and vice versa.
5. On-Balance Volume (OBV)
The on-balanced volume (OBV) is a trading indicator that uses change in volume to pr
edict price movements.
The key concept behind OBV is that changes in volume precede price movements.
The indicator attempts to capture the buying and selling pressure in the market by adding volume on days when the price closes higher and subtracting volume on days when the price closes lower.
OBV Calculation:
If the closing price is higher than the previous day’s closing price, then the day’s volume is added to the OBV.
If the closing price is lower than the previous day’s closing price, then the day’s volume is subtracted from the OBV.
If the closing price is unchanged, the OBV remains the same.
How To Use On Balance Volume Indicator
Rising OBV: When the OBV is rising, it suggests that the volume on up days is greater than the volume on down days,
Indicating bullish sentiment and potential strength in the current uptrend.
Falling OBV: Conversely, a falling OBV suggests that the volume on down days is dominating, indicating bearish sentiment and potential weakness in the current downtrend.
Divergences: Traders also look for divergences between OBV and price movements.
For example, if prices are making new highs, but OBV is not confirming these highs, it might signal a potential reversal or weakening of the trend.
6. Bollinger Bands
Bollinger Bands is a popular technical analysis tool developed by John Bollinger in the early 1980s.
It consists of a set of three bands plotted on a price chart, providing a visual representation of volatility and potential price extremes.
Traders and analysts use Bollinger Bands to identify overbought or oversold conditions, potential trend reversals, and periods of market consolidation.
Here are the critical components of Bollinger Bands:
Middle Band (SMA): The middle band is a simple moving average (SMA) of the price over a specified number of periods.
The most common setting is a 20-period SMA, but traders can adjust this parameter based on their preferences and the characteristics of the market being analyzed.
Upper Band: The upper band is calculated by adding a specified number of standard deviations (typically two) to the middle band.
It represents the upper limit of expected price movement within the trend.
Lower Band: The lower band is calculated by subtracting a specified number of standard deviations (again, typically two) from the middle band.
It represents the lower limit of expected price movement within the current trend.
How To Use Bollinger Bands For Trading
Volatility: Bollinger Bands expand and contract based on market volatility.
Narrow bands indicate low volatility and wide bands suggest high volatility.
Overbought and Oversold Conditions: Prices that touch or exceed the upper band may be considered overbought, suggesting a potential reversal or correction.
Conversely, prices that touch or fall below the lower band may be regarded as oversold, indicating a potential upward reversal.
Trend Reversals: Reversal signals can occur when prices move outside the bands and then re-enter.
For example, a price move outside the upper band followed by a move back inside the upper band may signal a potential reversal to the downside.
Squeeze: A Bollinger Bands squeeze occurs when volatility is low and the bands contract (often tagged as accumulation).
Traders usually anticipate a significant price movement after a squeeze.
7. Anchored Volume Profile
The anchored volume profile is a technical analysis indicator that shows trading volume distribution at different levels over a specific period.
Unlike other traditional volume profiles that display volume over a fixed period like a day, week or month,
The AVP allows traders to choose their preferred starting point on a price chart to plot volume providing customizable and detailed view of volume distribution.
Key Features of Anchored Volume Profile
Customizable Anchor Point: The main advantage of the AVP is the flexibility to choose the starting point.
This could be a significant event like an earnings release, a market bottom, or any specific date relevant to the trader’s analysis.
Volume at Price Levels: The AVP shows the volume traded at each price level from the selected anchor point, helping traders identify price levels with high buying or selling interest.
Support and Resistance Levels: High-volume nodes (HVNs) on the profile indicate price levels where a lot of trading activity has occurred,
often acting as support or resistance levels. Low-volume nodes (LVNs) represent price levels with less trading activity, which can signify potential breakout or breakdown points.
Trend Analysis: By anchoring the profile to different points in an uptrend or downtrend, traders can gain insights into the strength of the trend and potential reversal points.
Frequently Asked Questions
What Is The Best Indicator For Crypto Trading?
Andrew’s pitchfork is the best crypto indicator because, unlike the others, it’s a leading indicator that can show you the direction of the trend.
Do Technical Indicators Work On Crypto?
Yes, technical indicators work in crypto, if you’re skilled at technical analysis and understand trading psychology you can make good profits.
What Indicators Should Be Used For Day Trading Crypto?
For day trading, I recommend you use Andrew’s pitchfork and VWAP.