When I started trading seven years ago, the first thing I heard from other crypto traders was support and resistance.
It’s the most elementary concept every trader must know.
Understanding support and resistance in crypto will help you make intelligent trading decisions that minimize loss.
What Is Support?
Imagine support as a sturdy floor beneath the price of an asset. It represents a level at which buying interest is sufficiently strong to prevent the price from falling further.
In essence, it’s like a safety net for the price, keeping it from going down further.
What Is Resistance
On the flip side, resistance acts as a formidable ceiling above the price. It signifies a level at which selling pressure becomes dominant, preventing the price from rising further.
Picture it as a barrier that the price struggles to breach, like a ship battling against strong winds.
The higher the price is, the more crypto holders want to sell, forming a resistance zone/level.
How To Identify Support And Resistance In Crypto
Analyze Historical Data
A cryptocurrency’s historical data can give you a clue about the possible areas of support and resistance.
To identify support and resistance, you have to look at the range where the cryptocurrency couldn’t go further in an uptrend or lower in a downtrend.
These areas are likely to be significant support and resistance zones.
Round Numbers And Psychological Levels
Humans generally love round numbers, and we tend to gravitate towards buying or selling something at rounded numbers.
Prices ending in zeros often serve as psychological resistance or support because traders want to buy or sell at those prices.
Bitcoin has a psychological resistance at $10,000, $20,000 etc.
Volume Analysis
Areas of support and resistance are often accompanied by high buying or selling pressure, which leads to an increase in volume.
The price of a cryptocurrency reacts sharply when it’s in an area of support or resistance.
Moving Averages
Moving averages can help you spot areas of support and resistance as the price of a cryptocurrency tends to react with it.
In an uptrend, you would notice that the price of a cryptocurrency often touches the moving averages before resuming its uptrend direction; hence, the moving averages act as dynamic support.
Similarly, in a downtrend, the price touches the moving averages before resuming its downward movement; hence, the moving averages act as resistance.
How To Draw Support And Resistance In Crypto?
Accurately drawing support and resistance lines is the key to making effective decisions that would make your trading profitable.
A common mistake most newbie traders make is drawing too many support and resistance lines, which can lead to confusion.
How To Draw Resistance Lines
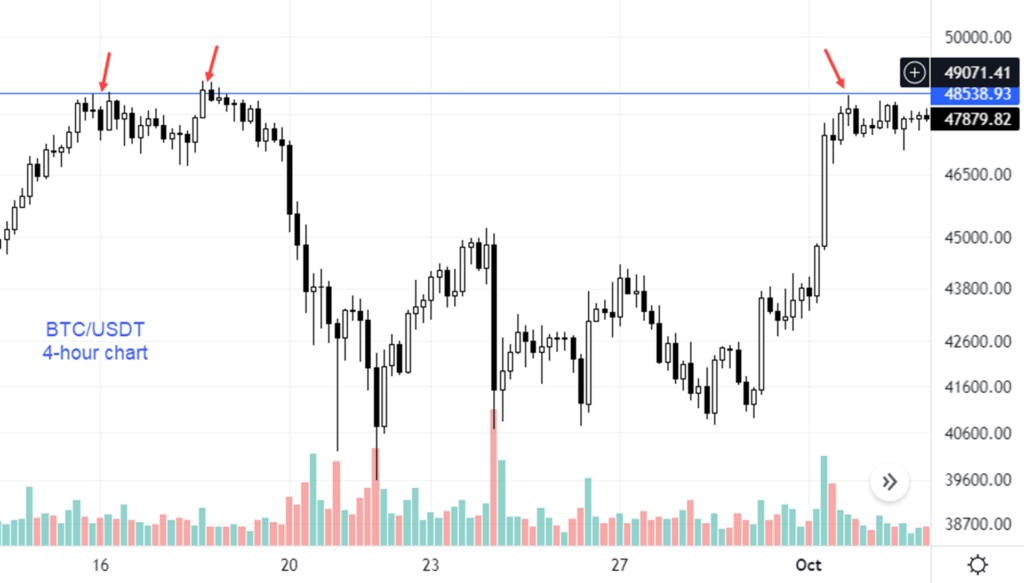
Identify areas where the price has repeatedly failed to break above, forming peaks or highs.
Connect these highs with a horizontal straight line. This line represents a resistance level where sellers are potentially entering the market in force.
The more times the price tests and fails to break above this level, the stronger the resistance becomes
How To Draw Support Lines
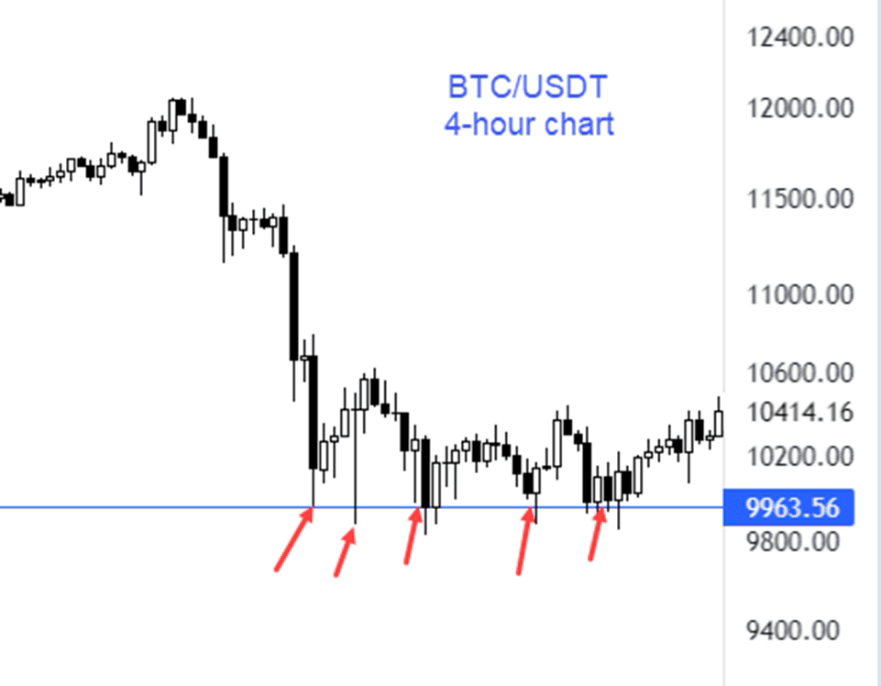
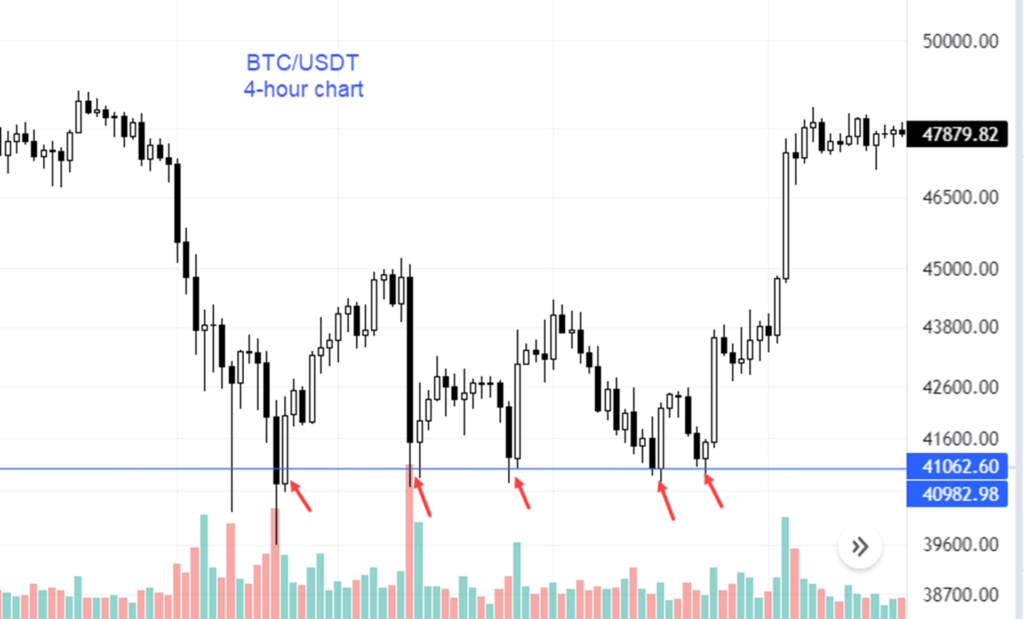
Identify areas where the price has repeatedly bounced back from, forming troughs or lows.
Connect these lows with a horizontal straight line. This line represents a support level where buyers are potentially entering the market in force.
The more times the price tests and fails to break below this level, the stronger the support becomes
Validate Your Lines
Check for significant buying or selling pressure when the price of the cryptocurrency enters the resistance or support zone, which causes the price to drop significantly or rise within a short time.
Note: when resistance is broken, it becomes support, and when support is broken, it becomes resistance.
How To Trade With Support And Resistance?
Having a good knowledge of support and resistance can make it easy for you to apply the following trading strategies;
Breakout Trading
Trading the breakout using support and resistance can create a good opportunity for trade entry and exit.
Most traders buy when a cryptocurrency’s price breaks a major resistance to the upside with significant volume and sell when a major support is broken.
In my everyday trading, I have found the strategy effective. It has helped me book some good profits and minimize losses.
Pullback Trading
Alternatively, you can employ pullback trading strategies, also known as “buying the dip” or “selling the rally.”
It’s a well-known pattern that when the price of a cryptocurrency breaks support and resistance, it comes back to retest it before going in the direction of the breakout.
After a breakout occurs, wait for the price to retrace back to the broken support or resistance level before entering or closing a trade.
Range Trading
During periods of consolidation, when the price fluctuates within a defined range, range trading strategies come into play.
Buy near support levels and sell near resistance levels until a breakout occurs, signaling a potential trend reversal.
Confirmation Indicators
Enhance your trading decisions by using confirmation indicators, such as oscillators (e.g., RSI, MACD) or candlestick patterns, to validate support and resistance levels.
The divergence between price and momentum indicators can provide valuable insights into potential trend reversals.
Risk Management
Even with a solid understanding of support and resistance, the market can turn against you and move in a direction you didn’t expect.
That’s why it’s essential to protect your trading capital by setting a stop loss and ensuring you don’t risk more than a certain percentage of your capital.
Frequently Asked Questions
Does Support And Resistance Work With Crypto?
Yes, support and resistance work in crypto trading, and it’s a critical concept that every successful trader can’t ignore.
The market moves in patterns which, most times, respect support and resistance zones.
A thorough understanding of the concept will help you avoid entering and exiting trades prematurely.
What Is The Best Support And Resistance Indicator In Crypto?
There is no official support and resistance indicator for crypto trading like the MACD or RSI on charting platforms.
However, on Tradingview, there are a few support and resistance indicators created by members of the community that can significantly help you identify support and resistance areas.
Every day, I use these indicators to highlight their importance.
The indicators are listed below. You can search for them on Tradingview under the “indicators” section.
Support and resistance dynamic by Luxalgo
Support resistance – dynamic by Lonesometheblue
Support resistance diagonal by Pikusov
What Is The Best Timeframe To Find Support And Resistance?
It depends on your trading style. If you’re a day trader, the best time frame for support and resistance would be a 4-hour chart, and if you’re a swing trader, it would be 1 Day.